The State of Financial Stability in the Southeast
Presented by VyStar Credit Union and TransUnion
Download the Full StudyExecutive Summary
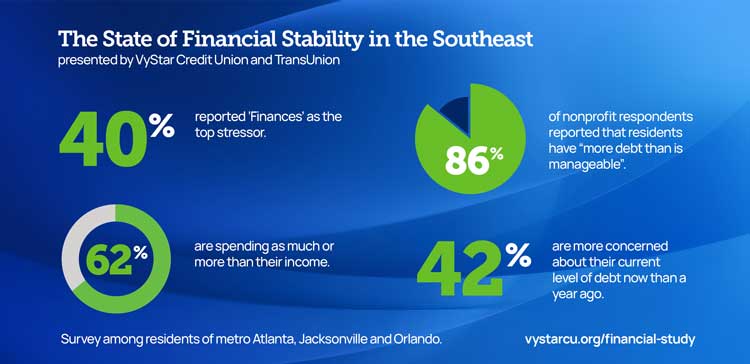
What: Nearly 40% of residents report finances as their top stressor. This far outpaces any other source of stress, signaling a widespread and urgent strain on financial well‑being across the Southeast.
So What: Financial stress is widespread, and reluctance to address or seek support makes the burden even heavier. Accessible, judgment-free tools and community-based support can strengthen overall well-being for residents and their families.
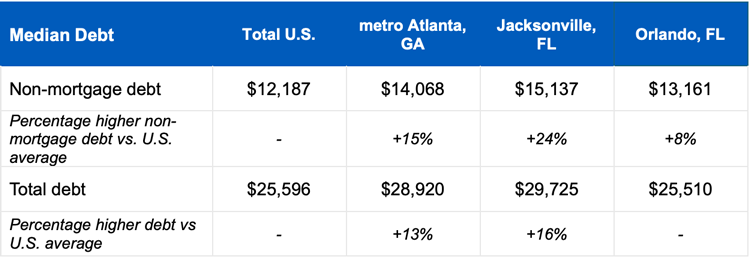
What: Debt is more of an issue in Southeastern regions vs. total U.S., with higher debt-to-income percentages, non-mortgage debt levels and delinquency rates. 86% of nonprofits report that residents are carrying more debt than is manageable.
So What: Financial stress is widespread, and reluctance to address or seek support makes the burden even heavier. Accessible, judgment-free tools and community-based support can strengthen overall well-being for residents and their families.
What: Debt concerns have increased for 42% of residents, yet 62% still label their debt as ‘manageable,’ even though many describe living in ‘survival mode.
So What: There is a disconnect between perceived and actual financial strain. Offering clarity on what truly constitutes manageable debt is an essential first step in financial education.
What: A variety of factors drive debt dynamics, including financing more, low on-time bill payment (48%), mounting credit card interest (64%), delinquencies and rising pressure from inflation and affordability. Residents express a need for greater education on all of these topics.
So What: Tailor education and messaging to discuss key stages of the debt journey to make guidance more digestible, relevant, and actionable for residents.
What: Planning, spending and borrowing are areas where the Southeastern regions have the most need. Financial institutions are the top professional sources for guidance on individual finances. Interest in interactive tools that provide a personalized perspective is 49% higher than generic online lessons or monthly newsletters.
So What: There is a strong opportunity to equip residents with simple, trusted tools that support better debt decisions. Practical payoff strategies can help residents understand their financial picture, take action earlier and ease the burden of debt‑related stress. Educating residents on how underlying planning, spending and borrowing habits impact their debt situation empowers them to make informed choices and builds financial confidence.
Introduction
"Financing is a tool, not a lifeline. Used wisely, it accelerates growth and strengthens your position."
— Allison Dunn
"Financial peace isn’t the acquisition of stuff. It’s learning to live on less than you make, so you can give money back and have money to invest."
— Dave Ramsey
The Southeastern U.S. is a victim of its own success. For many years, these markets were attractive for their affordability and low cost of living, which fueled decades of massive migration from the Northeast and Midwest. This exploded post-pandemic.
The result is that affordability is largely gone, leaving the original locals struggling with a cost-of-living structure that has outpaced local wage growth.
The influx of remote workers with "Northern salaries" into cities like metro Atlanta, Jacksonville and Orlando created a permanent step-change in housing costs. Residents are now borrowing more to maintain their current lifestyles, at the expense of their credit scores and own financial health. Through a community partner survey with local nonprofits, the conducted financial health survey results and data provided by TransUnion, we outline that these markets have higher levels of debt along with lower credit scores.
In recent years, many residents across the state of Georgia have struggled with financial hardship, marked by high levels of personal debt and ongoing cost pressures. Nearly 45 % of Georgia households earn too little to afford basic necessities even if they are employed, falling below the “ALICE” (Asset Limited, Income Constrained, Employed) threshold or the official poverty level, which illustrates widespread economic fragility.
Florida is frequently cited in 2025–2026 data as one of the most financially distressed states in the country. Jacksonville and Orlando often rank in the top tier for "financial hardship," characterized by high rates of credit delinquency. Volatility of the real estate market and rising insurance premiums are additional stressors in Florida.
Background & Objectives
This study explores the financial health of three unique regions of the Southeast U.S. with a focus on debt in the cities of metro Atlanta, Jacksonville and Orlando.
We also explore areas where stakeholders can make meaningful improvements. Our research helps to bring into focus underlying challenges residents of these markets have with their debt and overall financial situation. This research offers insight into the realities faced by residents of these markets and spur community, business, city and county leaders to act.
Methodology
Financial Health Framework Survey
A survey among 2,800 respondents was conducted across Southeastern markets by an independent, nonpartisan research agency in December 2025. The sample included residents from metro Atlanta, Jacksonville and Orlando.
The survey consisted of the Financial Health Framework, developed by the Financial Health Network (FHN) and attitudinal measures to uncover deeper insights about residents’ feelings about their current financial situation to shed light on the results from the Financial Health Data.
Financial Health Framework
Financial Health Measurement
Financial health is a composite framework that considers the totality of people’s financial lives: whether they are spending, saving, borrowing and planning in ways that will enable them to be resilient and pursue opportunities. Financial health provides researchers with a useful metric for exploring the financial circumstances of people in America.
Figure 1. Indicators of Financial Health.
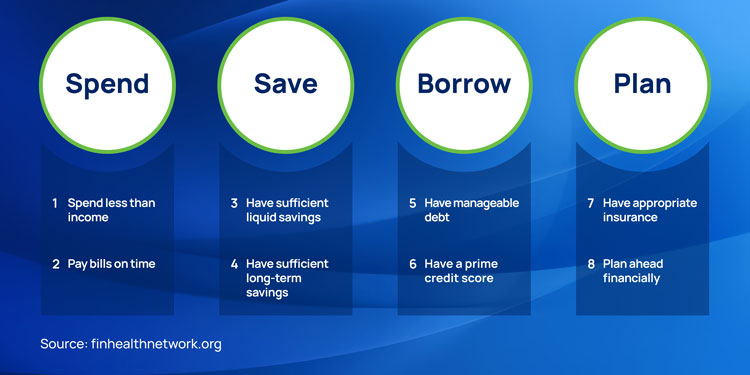
Calculating FinHealth Scores®
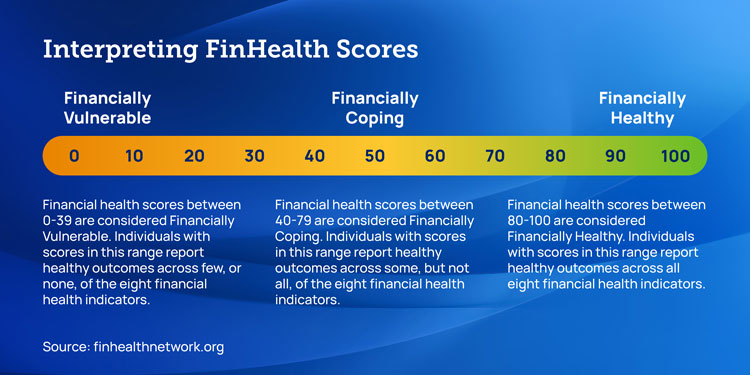
The FinHealth Score is a metric based on survey questions that aligns with the eight indicators of financial health (see Figure 1). Each respondent has an overall FinHealth Score and four sub scores (Spend, Save, Borrow and Plan) can be calculated. FinHealth Scores range from 0-100 and can be used to categorize respondents into three financial health tiers: Financially Vulnerable, Financially Coping or Financially Healthy (see Figure 2)
Figure 2. Interpreting FinHealth Scores.
Debt And Financial Profile
TransUnion data and insights from the TransUnion US Consumer Credit Database were used to benchmark these markets to national statistics on key performance indicators of financial health and debt profile relative to national dynamics.
Statistical Significance and Figures
All results discussed in this report are statistically significant within a 95% confidence interval, unless otherwise noted. Figures are rounded to the nearest integer; as a result, figures may not sum to 100%.
Debt is more of an issue in Southeastern markets than nationally
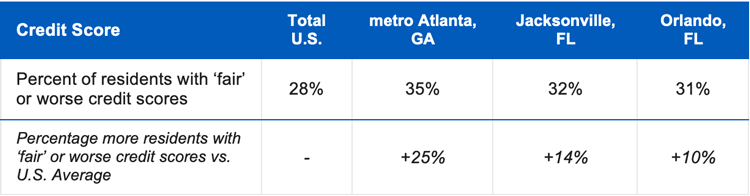
Through data provided from TransUnion U.S. Consumer Credit Database, along with insights form this survey, we see that residents in Southeastern markets have lower credit scores, higher rates of credit delinquency and higher amounts of non-mortgage debt.
Figure 3: Southeastern Markets Exhibit Credit Score Challenges

Table 1. Delinquencies & Credit Scores
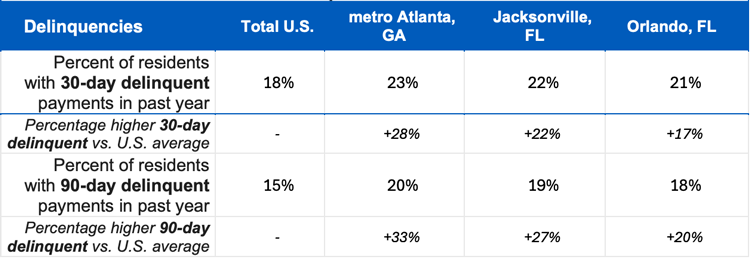
Source: TransUnion U.S. Consumer Credit Database
These key metrics show that these markets are more debt-depressed and worse off than national averages, prompting our attitudinal survey to understand how they feel about their financial situation and incorporate the perspective of the Financial Health Framework. This allowed us to uncover key recommendations for impactful support for residents in the Southeast region.
Assessing Financial Health Across The Southeast Region
In this section, we show how the financial health of residents of three key Southeastern cities (metro Atlanta, Jacksonville and Orlando) compares to the total U.S. in a few key metrics, using the financial health measurement framework from FHN.
Residents in Southeastern markets confirm their debt and finance situation
Only 19% of residents across the Southeastern region qualify as financially healthy versus 31% in the United States overall, showing the less favorable financial situation in these markets (see Figure 4).
Figure 4. Financial Health of Key Southern Markets And Total U.S.

* Statistically significant relative to total U.S. (p < 0.05).
Financial Instability Is the Leading Source of Stress Across the Southeast
Financial health is an essential component of overall personal wellness. Just as people depend on physical health, family stability and job security to support their well‑being, they also rely on a strong financial foundation. Across the Southeast region, residents report that financial pressure is having an overwhelming impact on their emotional and mental wellness.
40% of residents across the Southeast region reported that the top stressor in their life is their finances (see Figure 2). This is over three times higher than the second most common stressor, their job, highlighting just how impactful their finances are in the level of stress felt among residents.
Figure 5: Top Life Stressor

According to the United Way The State of ALICE in Florida Report, households below the ALICE Threshold are forced to make impossible choices — like deciding whether to pay for utilities or a car repair, whether to buy food or fill a prescription, emphasizing the profound influence financial instability has on residents’ stress.
The weight of this stress indicates that financial wellness must be treated as a core pillar of personal well‑being, equally as important as caring for one’s physical health, family and work.
This insight is critical for community leaders, policymakers and financial institutions. Helping residents strengthen their financial stability is not only about improving debt management and saving strategies. It is about reducing severe, chronic stress that directly affects quality of life across the communities we serve.
There is a disconnect among residents of Southeastern markets who are increasingly concerned about their debt, yet consider it ‘manageable’
Residents Have a Lot of Concern About Debt
42% of residents in these markets are more concerned about their current level of debt now than they were a year ago. Over one-third of residents (36%) are very or extremely concerned about their current levels of debt (see Figure 6).
Figure 6. Percent Of Residents Concerned About Current Amount OF Debt And Change in Concern Compared To Last Year

* Statistically significant relative to one other market (p < 0.05).
While there is concern about the level of debt, residents are no more likely to consider their debt unmanageable than the total U.S. (see Figure 7).
Figure 7. Percent of Residents Considering Their Debt Manageable vs. Unmanageable

*Statistically significant relative to total U.S. (p < 0.05).
Despite considering their debt “manageable,” there is a high level of debt and debt-to-income ratios in this region. The higher levels of debt lead to late payments, delinquencies and lower credit scores (see Table 1).
Table 1. Delinquencies & Credit Scores
Source: TransUnion U.S. Consumer Credit Database
Recommendation: Developing a simple debt-to-income comparison tool to personalize debt measurement dynamics
Credit Card Debt is Prevalent
Residents in Southeastern markets are more likely to carry revolving credit card debt than national averages, which is the most common type of debt carried.
Among those with credit card debt across the Southeast region, only 56% make more than the minimum payment, while 15% are unable to make even the minimum payment (see Figure 10).
Figure 10. Amount of Debt Residents Pay Off Per Month.

*Statistically significant relative to total Southeastern market residents (p < .05).
Recommendation: Providing guidance on manageable levels of credit card debt and the behaviors that best support those levels. These residents need strategies on the importance of paying more than the minimum payment on credit cards whenever possible to help lift themselves out of debt. They may also need reminders that slow repayment often results in higher costs later.
Homeownership is low across the Southeast region, ranging from 54% to 58% (1,2) , which is below the national average of 65% (3). The rates of mortgages held in residents sampled are even lower, indicating that new homeownership has declined. In addition to not building equity, renters miss money-saving tax deductions from mortgage interest.
Sources
United Way ALICE ® Report: The State of ALICE in Florida
United Way ALICE ® Report: The State of ALICE in Georgia
Federal Reserve Economic Data (FRED) Federal Reserve Bank of St. Louis
Residents are Struggling to Pay Off Debt
With debt rising in these markets, residents are struggling to pay their bills. Over half (51%) of residents report not paying all their bills on time, well above national benchmarks of 29% (see Figure 12).
Figure 12. Percent of Residents Not Paying All Their Bills on Time

* Statistically significant relative to total U.S. (p < 0.05).
* *Statistically significant relative to total U.S. and total Southeastern average (p < 0.05).
Spending across the Southeast region is on the rise, further impacting the amount of debt held and how much debt can be paid off
Concerns Rise as Spending Rises
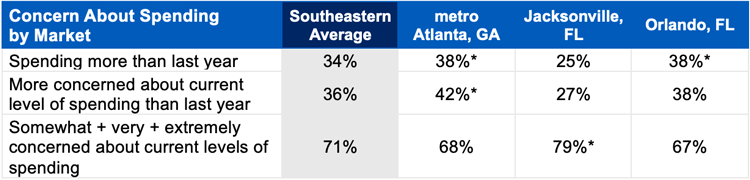
Residents in these markets are spending more than they were last year and are more concerned about their spending this year. 34% of residents feel they are spending more this year than last year, and 36% are more concerned about their spending than last year. In all, 71% of residents in these markets are concerned with their current level of spending (See Table 2).
Table 2. Residents’ Concern About Spending
* Statistically significant relative to total Southeastern market residents (p < 0.05).
This increase in concern comes as residents are more likely to be spending as much or more than their income than national benchmarks (see Figure 13).
Figure 13. Spending Compared to Income By Market

* Statistically significant relative to total U.S. (p < 0.05).
Southeastern residents are not saving, increasing their concern
Residents are Concerned About Their Savings
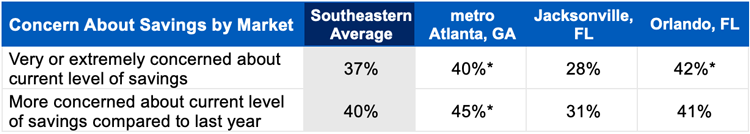
Concerns about savings are high, as 37% of residents are very or extremely concerned about their level of savings. This concern is growing, with 40% of residents reporting being more concerned about their level of savings compared to last year (see Table 4).
Table 4. Residents’ Concern About Savings
* Statistically significant relative to total Southeastern market residents (p < 0.05).
Half have not started saving for retirement. Only 45% of Southeastern residents have a formal retirement account (see Table 7).
Table 7. Retirement Savings Account Longevity & Type
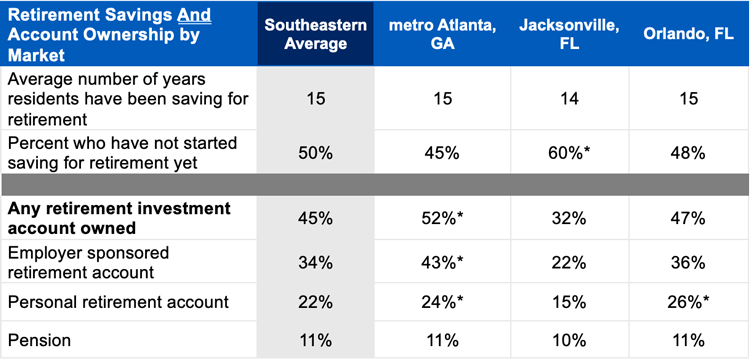
* Statistically significant relative to another market (p < 0.05).
Conclusion
Lack of financial knowledge and information resources appear to be contributing to misperceptions about their financial situation
The financial situation in metro Atlanta, Jacksonville and Orlando is even more severe than the rest of the United States, with debt levels rising and discretionary income shrinking. While the situation is not drastic yet, the warning signs are there, and without any intervention the situation will continue to get worse. Without targeted, multi‑faceted intervention, these early warning signs are likely to intensify.
There is a great need for accessible and judgment-free financial education in these markets to help residents address debt and improve financial stability.
Educating residents about what ‘manageable debt’ looks like, while recognizing the concerns that may hold them back, creates a more approachable path that will help communities better manage their debt.
For a deeper dive into the specifics along the FHN Framework of Savings, Debt, Borrowing and Planning of residents in Southeast markets please refer to the full The State of Financial Stability in the Southeast Presented by VyStar Credit Union and TransUnion report.
To explore individual markets in more detail, review the market-specific State of Financial Stability in the Southeast Presented by VyStar Credit Union and TransUnion studies.
*NO PURCHASE NECESSARY TO ENTER OR WIN. Open only to legal Florida and Georgia residents who are 18 or older. Begins on January 26, 2026, and ends on April 30, 2026. Sweepstakes subject to complete Official Rules, available at https://info4.vystarcu.org/debt-payoff-challenge-official-rules. SPONSOR: VyStar Credit Union. Void where prohibited.